
這篇文章介紹如何使用 Promtail、Loki 和 Grafana 建立 Nginx Proxy Manager 的監控系統,透過解析 Nginx 日誌並將數據視覺化,以便追蹤流量、狀態等資訊。內容包含部署 Grafana、Loki、Promtail,配置 Nginx Proxy Manager 的 geoip2 和 json log,以及在 Grafana 中設定資料來源和匯入 Dashboard。
使用 promtail 解析 nginx proxy manager 的 log 後,送入 loki database。Grafana 讀取 loki 的資料並以 dashboard 將數據視覺化。
1. 部署 grafana#
如果尚未有 grafana 的 container,請參考 grafana。
2. 新增 docker network#
為了方便 grafana, loki 以及 promtail 的 container 之間通訊,因此提前先創建一個 bridge mode 的 docker network。如果有其他方法或需求,可以直接跳至步驟三。
- 可以使用 portainer 增新網路配置。
- 或是通過命令:
docker network create grafanaGrafana 的容器設置一併做相應的調整喔~ (加上 network 設定)
3. 調整 Nginx Proxy Manager 的 Nginx 設置#
Nginx 需要調整的部分有兩個,分別是「啟用 geoip2」和「配置 json log formator」。
啟用 geoip2#
在 nginx 資料夾中增新以下檔案與資料。
/appdata/npm/data/nginx
├── custom
│   |── events.conf
│   |── http_top.conf
│   └── server_proxy.conf
└──  geoip2
    |── GeoLite2-ASN.mmdb
    |── GeoLite2-City.mmdb
    └── GeoLite2-Country.mmdb
其中
GeoLite2-ASN.mmdb,GeoLite2-City.mmdb和GeoLite2-Country.mmdb需要下載 (或參考 P3TERX/GeoLite.mmdb。 ):events.confworker_connections 20000; multi_accept on;http_top.confgeoip2 /data/nginx/geoip2/GeoLite2-Country.mmdb { auto_reload 5m; $geoip2_metadata_country_build metadata build_epoch; $geoip2_data_country_code default=TW source=$remote_addr country iso_code; $geoip2_data_country_name default=Taiwan country names en; } geoip2 /data/nginx/geoip2/GeoLite2-City.mmdb { $geoip2_data_city_name default=Unknown city city names en; } geoip2 /data/nginx/geoip2/GeoLite2-ASN.mmdb { $geoip2_data_asn_code default=000 autonomous_system_number; } log_format json_analytics escape=json '{' '"time_local": "$time_local", ' '"remote_addr": "$remote_addr", ' '"request_uri": "$request_uri", ' '"status": "$status", ' '"server_name": "$server_name", ' '"request_time": "$request_time", ' '"request_method": "$request_method", ' '"bytes_sent": "$bytes_sent", ' '"http_host": "$http_host", ' '"http_x_forwarded_for": "$http_x_forwarded_for", ' '"http_cookie": "$http_cookie", ' '"server_protocol": "$server_protocol", ' '"upstream_addr": "$upstream_addr", ' '"upstream_response_time": "$upstream_response_time", ' '"ssl_protocol": "$ssl_protocol", ' '"ssl_cipher": "$ssl_cipher", ' '"http_user_agent": "$http_user_agent", ' '"remote_user": "$remote_user", ' '"geoip2_data_country_code": "$geoip2_data_country_code", ' '"geoip2_data_country_name": "$geoip2_data_country_name", ' '"geoip2_data_city_name": "$geoip2_data_city_name", ' '"geoip2_data_asn_code": "$geoip2_data_asn_code"' '}';server_proxy.confaccess_log /data/logs/json_access.log json_analytics; error_log /data/logs/json_error.log warn;
增新以下資料夾與檔案
/appdata/npm/nginx-configs
└── nginx-configs
    ├── modules
    |   └── geoip2.conf
    └── proxy.conf
檔案內容分別如下:
geoip2.conf用於載入 geoip2 模組
load_module /usr/lib/nginx/modules/ngx_http_geoip2_module.so; load_module /usr/lib/nginx/modules/ngx_stream_geoip2_module.so;proxy.conf用於加入標頭
# geoip2
proxy_set_header geoip2-COUNTRY-CODE $geoip2_data_country_code;
proxy_set_header geoip2-COUNTRY-NAME $geoip2_data_country_name;
proxy_set_header geoip2-CITY-NAME    $geoip2_data_city_name;
proxy_set_header geoip2-ASN-CODE     $geoip2_data_asn_code;
proxy_set_header geoip2-IP-Address   $remote_addr;

# default
add_header       X-Served-By $host;
proxy_set_header Host $host;
proxy_set_header X-Forwarded-Scheme $scheme;
proxy_set_header X-Forwarded-Proto  $scheme;
proxy_set_header X-Forwarded-For    $proxy_add_x_forwarded_for;
proxy_set_header X-Real-IP          $remote_addr;
proxy_pass       $forward_scheme://$server:$port$request_uri;
在 nginx proxy manager 的 Docker Compose File 增新 geoip2 配置的 volume 映射:
volumes:
  - /appdata/npm/nginx-configs/proxy.conf:/etc/nginx/conf.d/include/proxy.conf
  - /appdata/npm/nginx-configs/modules/geoip2.conf:/etc/nginx/modules/geoip2.conf
隨後重啟 nginx proxy manager。
4. 部署 loki 和 promtail#
4.1. loki 配置#
創建 loki 的資料夾與檔案
/appdata └── loki └── config-loki └── local-config.yamllocal-config.yamlauth_enabled: false server: http_listen_port: 3100 common: path_prefix: /loki storage: filesystem: chunks_directory: /loki/chunks rules_directory: /loki/rules replication_factor: 1 ring: kvstore: store: inmemory schema_config: configs: - from: 2020-10-24 store: boltdb-shipper object_store: filesystem schema: v11 index: prefix: index_ period: 24h ruler: alertmanager_url: http://localhost:9093 query_scheduler: max_outstanding_requests_per_tenant: 2048 limits_config: allow_structured_metadata: false
修改 loki 資料夾的權限
由於 loki 使用 10001 用戶操作資料,因此需要調整 loki 資料夾與其下檔案的擁有者。
sudo chown -R 10001:10001 /appdata/loki
4.2. promtail 配置#
創建 promtail 的資料夾與檔案
/appdata └── promtail └── config-promtail └── config.ymlconfig.ymlserver: http_listen_port: 9080 grpc_listen_port: 0 positions: filename: /tmp/positions.yaml clients: - url: http://loki:3100/loki/api/v1/push scrape_configs: - job_name: npm_logs static_configs: - targets: - localhost labels: job: npm_logs __path__: /var/log/npm-logs/json_*.log pipeline_stages: - json: expressions: time_local: time_local remote_addr: remote_addr request_uri: request_uri status: status server_name: server_name request_time: request_time request_method: request_method bytes_sent: bytes_sent http_host: http_host http_x_forwarded_for: http_x_forwarded_for http_cookie: http_cookie server_protocol: server_protocol upstream_addr: upstream_addr upstream_response_time: upstream_response_time ssl_protocol: ssl_protocol ssl_cipher: ssl_cipher http_user_agent: http_user_agent remote_user: remote_user geoip2_data_country_code: geoip2_data_country_code geoip2_data_country_name: geoip2_data_country_name geoip2_data_city_name: geoip2_data_city_name - labels: status: server_name: request_method: geoip2_data_country_code: geoip2_data_country_name:
4.3. 配置 Docker Compose File#
services:
  loki:
    image: grafana/loki:latest
    restart: 'unless-stopped'
    ports:
      - "3100:3100"
    command: -config.file=/etc/loki/local-config.yaml
    volumes:
      - /home/rxchi1d/appdata/loki:/loki # Loki persistent data folder
      - /home/rxchi1d/appdata/loki/config-loki:/etc/loki # Loki config folder
    networks:
      - grafana

  promtail:
    image: grafana/promtail:latest
    restart: 'unless-stopped'
    volumes:
      - /home/rxchi1d/appdata/npm/data/logs/:/var/log/npm-logs:ro # path to your NPM logs, add else if you need
      - /home/rxchi1d/appdata/promtail/config-promtail/config.yml:/etc/promtail/config.yml # Promtail config folder
    command: -config.file=/etc/promtail/config.yml
    networks:
      - grafana

networks:
  grafana:
    external: true
5. 設置 Grafana#
進入 Grafana (http://grafana-host:3000)
增新 data source
Connections-Data sources選擇Add new data source選擇
LokiName 為
loki,Connection 的 url 填入http://loki:3100。隨後點擊Save & test。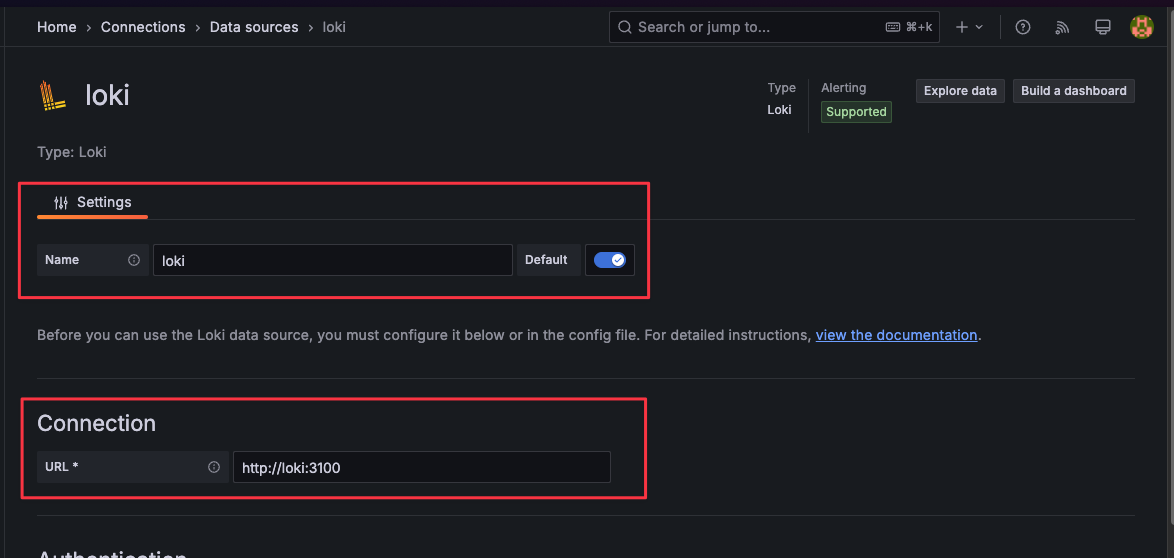
增新 Dashboard
進入
Dashboards,點擊New-Import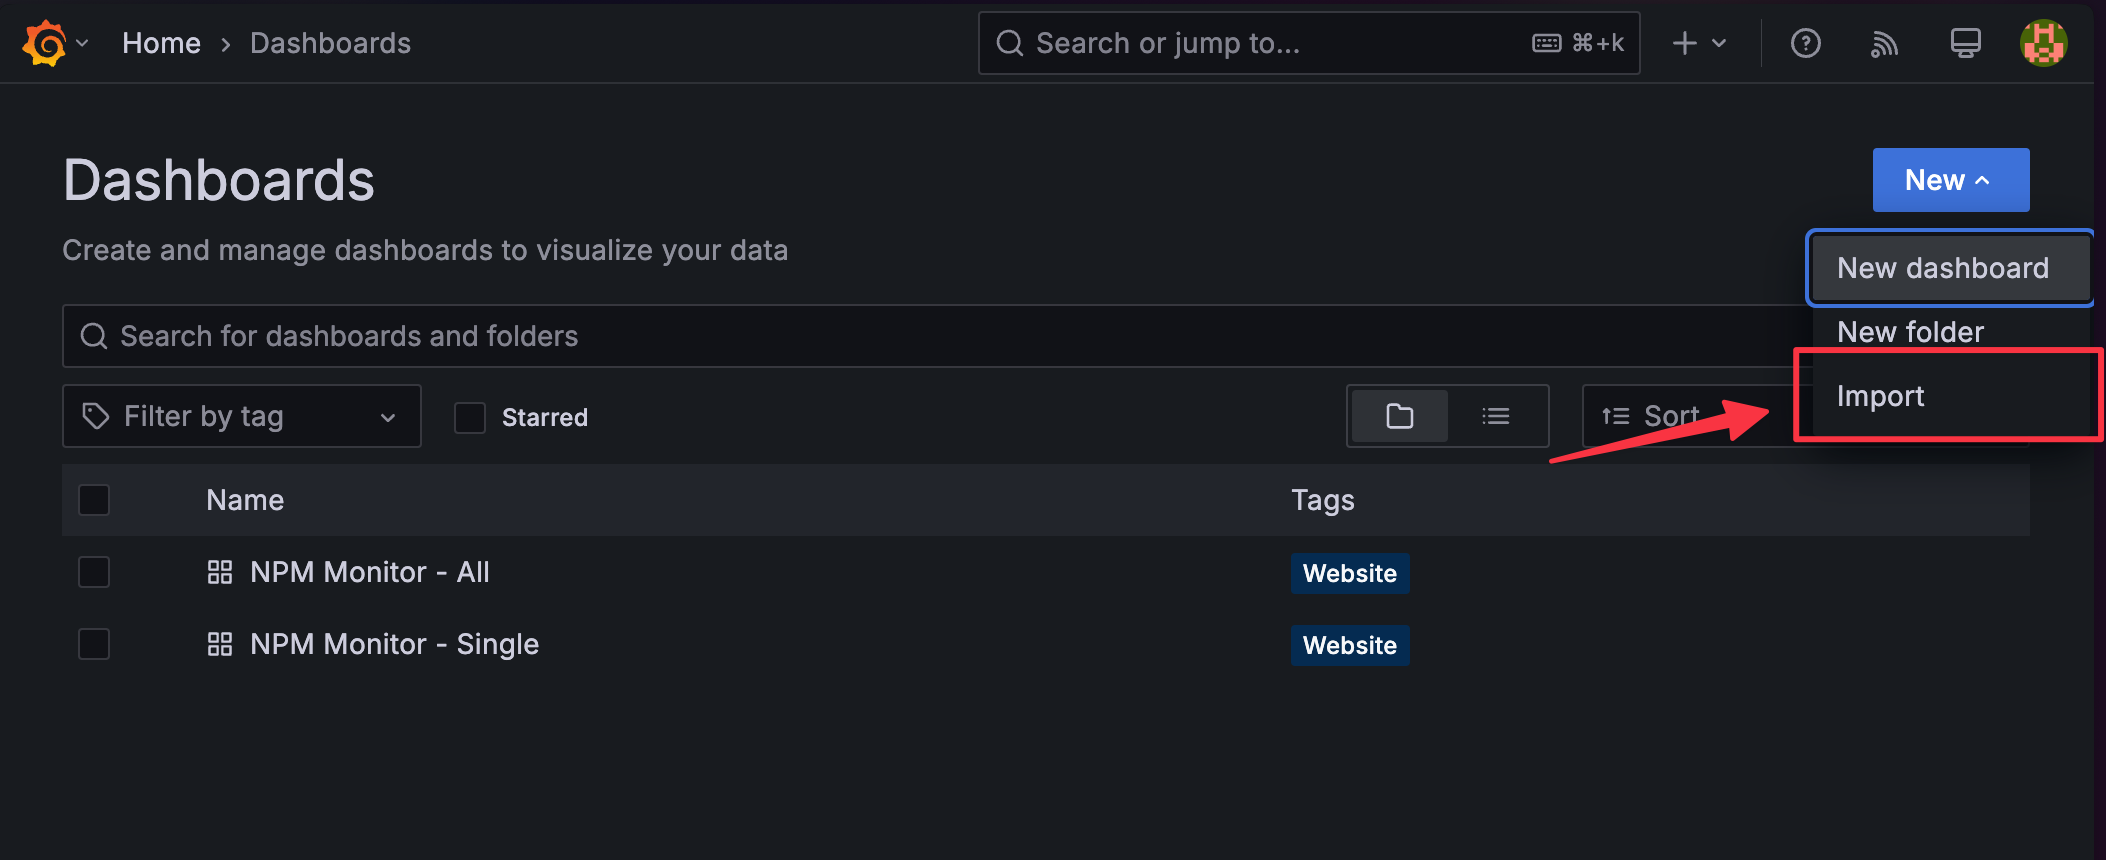
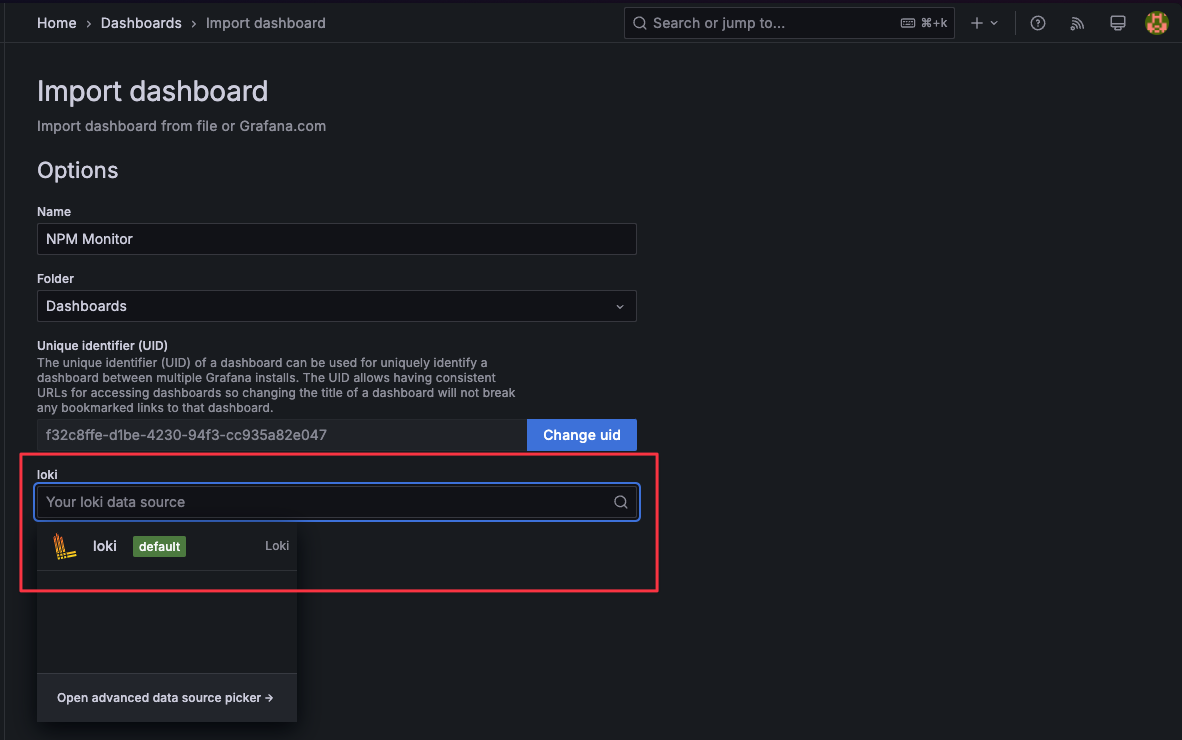
上傳 NPM-Monitor 的 json
選擇對應的 loki Data Source
按需求調整 labelFilter 與 regexFilter
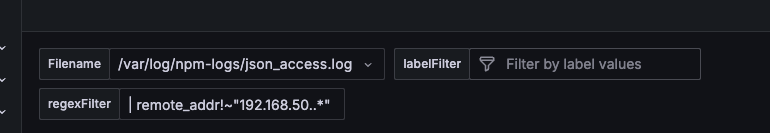
預設 regexFilter 用以排除來源為
192.168.50.0/24之資料。兩個使用的優先級為 labelFilter > regexFilter。
設計兩種 Filter 的原因labelFilter 的過濾效率比較高,也易於使用,但為了避免將變化較大的資料轉換成 label 造成 loki 負擔。因此對於值變化較大的參數,比如 remote_addr,可以使用 regexFilter 過濾。