這篇文章詳細介紹如何利用 Prometheus、Node Exporter、cAdvisor 和 Grafana 搭建一套完整的 Docker 容器監控系統。內容涵蓋建立 Docker 網路、準備 Prometheus 設定檔、使用 Docker Compose 部署監控服務,以及在 Grafana 中設定資料來源與匯入儀表板,幫助使用者有效監控 Docker 容器的效能與狀態。
使用 promtail 解析 nginx proxy manager 的 log 後,送入 loki database。Grafana 讀取 loki 的資料並以 dashboard 將數據視覺化。
1. 部署 Grafana#
如果尚未有 grafana 的 container,請參考 grafana。
2. 新增 docker network#
為了方便 grafana, loki 以及 promtail 的 container 之間通訊,因此提前先創建一個 bridge mode 的 docker network。如果有其他方法或需求,可以直接跳至步驟三。
- 可以使用 portainer 增新網路配置。
- 或是通過命令:
docker network create grafana3. 準備 prometheus 的資料夾與設定檔#
創建以下資料夾和檔案:
/appdata/prometheus ├── config │ └── prometheus.yml └── dataprometheus.yml# my global config global: scrape_interval: 15s # Set the scrape interval to every 15 seconds. Default is every 1 minute. evaluation_interval: 15s # Evaluate rules every 15 seconds. The default is every 1 minute. # scrape_timeout is set to the global default (10s). # Alertmanager configuration alerting: alertmanagers: - scheme: http static_configs: - targets: - "alertmanager:9093" # Load rules once and periodically evaluate them according to the global 'evaluation_interval'. #rule_files: # - "first_rules.yml" # - "second_rules.yml" # A scrape configuration containing exactly one endpoint to scrape: # Here it's Prometheus itself. scrape_configs: # The job name is added as a label `job=<job_name>` to any timeseries scraped from this config. - job_name: 'prometheus' # Override the global default and scrape targets from this job every 5 seconds. scrape_interval: 5s static_configs: - targets: ['localhost:9090'] - job_name: 'cadvisor' scrape_interval: 5s static_configs: - targets: ['cadvisor:8080'] - job_name: 'node-exporter' scrape_interval: 5s static_configs: - targets: ['node-exporter:9100']
調整 prometheus 資料夾的權限
prometheus 預設使用 65534 用戶
sudo chown -R 65534:65534 /appdata/prometheus
4. 部署 prometheus, node-exporter 和 cadvisor#
docker compose fileservices: cadvisor: container_name: cadvisor image: gcr.io/cadvisor/cadvisor:latest hostname: cadvisor restart: unless-stopped privileged: true networks: - grafana expose: - 8080 command: - '-housekeeping_interval=15s' - '-docker_only=true' - '-store_container_labels=false' devices: - /dev/kmsg volumes: - /:/rootfs:ro - /var/run:/var/run:rw - /sys:/sys:ro - /var/lib/docker/:/var/lib/docker:ro - /dev/disk/:/dev/disk:ro - /etc/machine-id:/etc/machine-id:ro node-exporter: container_name: node-exporter image: prom/node-exporter:latest hostname: node-exporter restart: unless-stopped networks: - grafana expose: - 9100 command: - --path.procfs=/host/proc - --path.sysfs=/host/sys - --path.rootfs=/host - --collector.filesystem.mount-points-exclude - ^/(sys|proc|dev|host|etc|rootfs/var/lib/docker/containers|rootfs/var/lib/docker/overlay2|rootfs/run/docker/netns|rootfs/var/lib/docker/aufs)($$|/) volumes: - /proc:/host/proc:ro - /sys:/host/sys:ro - /:/rootfs:ro - /:/host:ro,rslave prometheus: container_name: prometheus image: prom/prometheus:latest hostname: prometheus restart: unless-stopped command: - '--config.file=/etc/prometheus/prometheus.yml' - '--storage.tsdb.path=/prometheus' - '--storage.tsdb.retention.time=1y' # /!\ Uncomment the following line to set a size limit for the Prometheus database /!\ # - '--storage.tsdb.retention.size=10GB' networks: - grafana expose: - 9090 volumes: # /!\ To be modified depending on your needs /!\ - /home/rxchi1d/appdata/prometheus/data:/prometheus - /home/rxchi1d/appdata/prometheus/config/prometheus.yml:/etc/prometheus/prometheus.yml depends_on: - cadvisor - node-exporter networks: grafana: external: true
5. 設置 Grafana#
進入 Grafana (
http://grafana-host:3000)增新 data source
Connections-Data sources選擇Add new data source選擇
PrometheusName 為
prometheus,Connection 的 url 填入http://prometheus:9090。隨後點擊Save & test。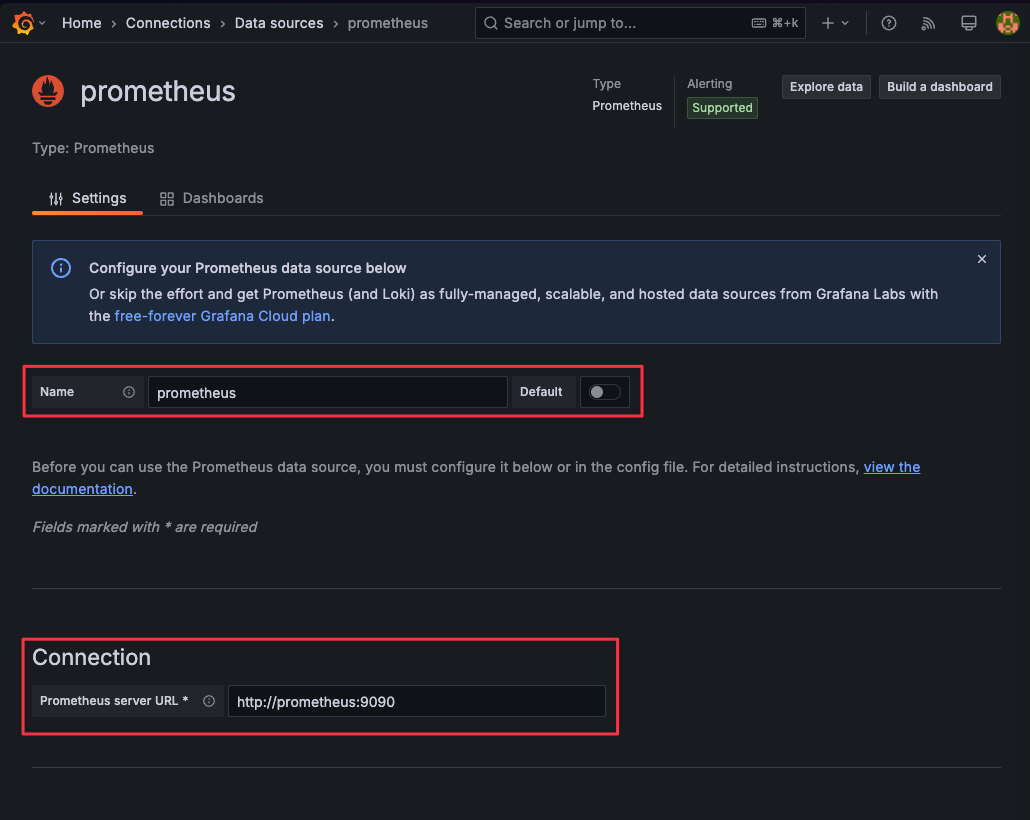
增新 Dashboard
進入
Dashboards,點擊New-Import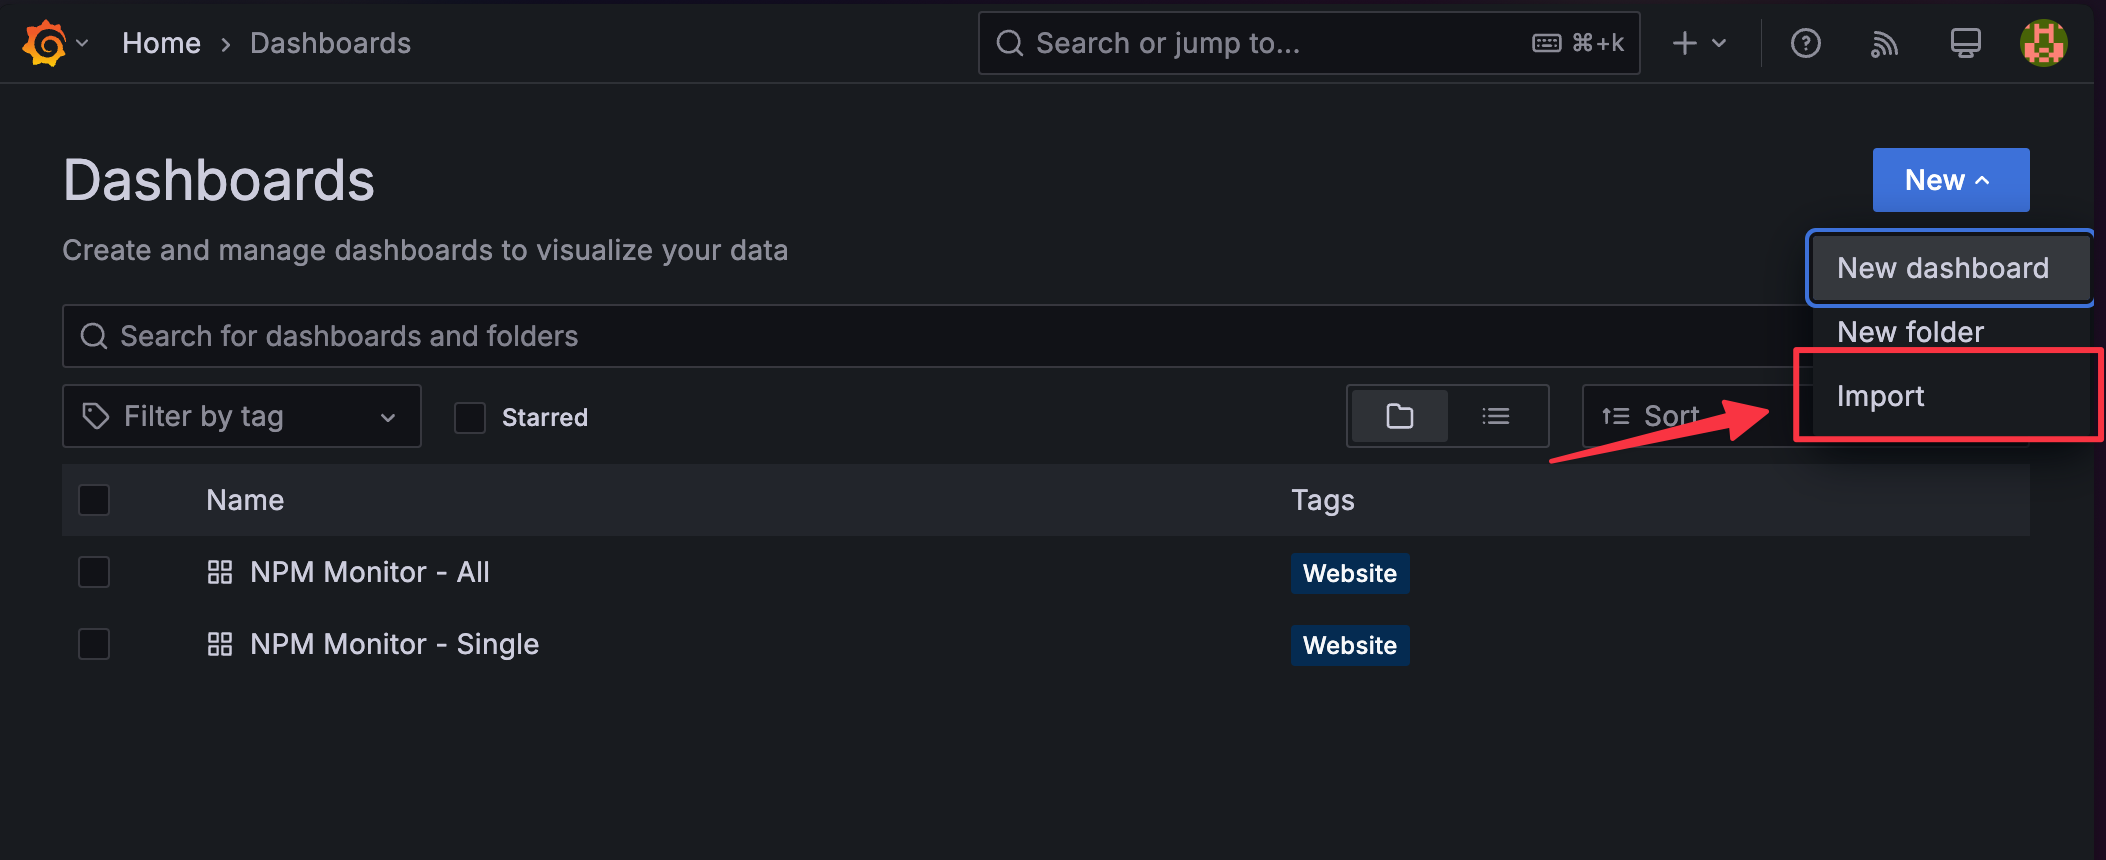
上傳 NPM-Monitor 的 json
使用 id
15120創建 dashboard。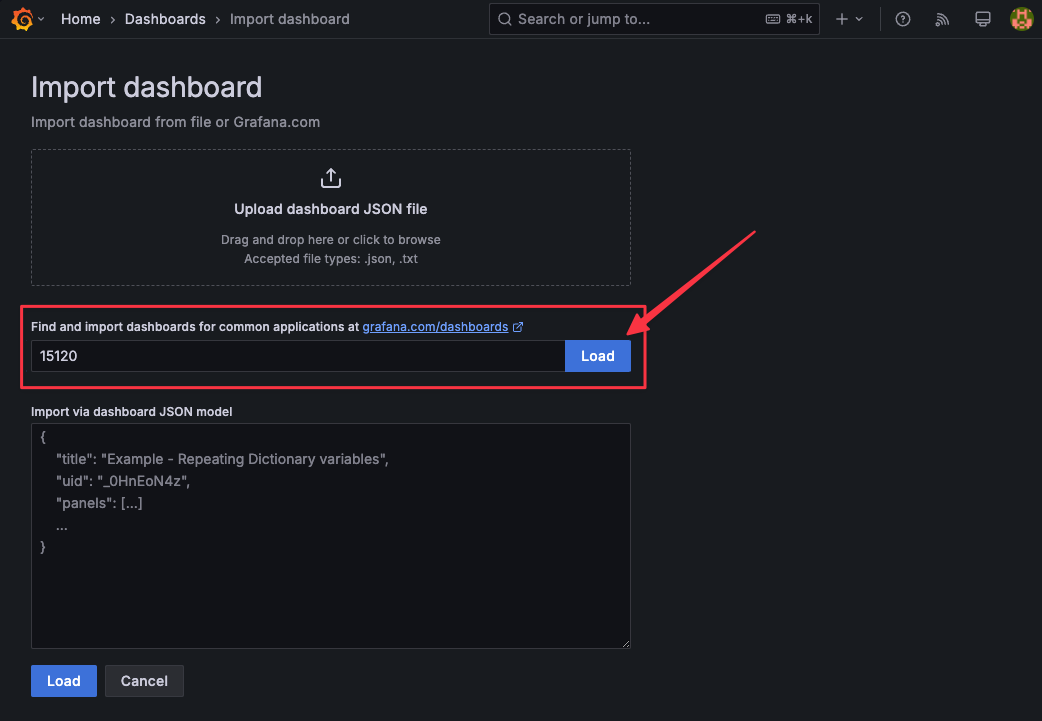
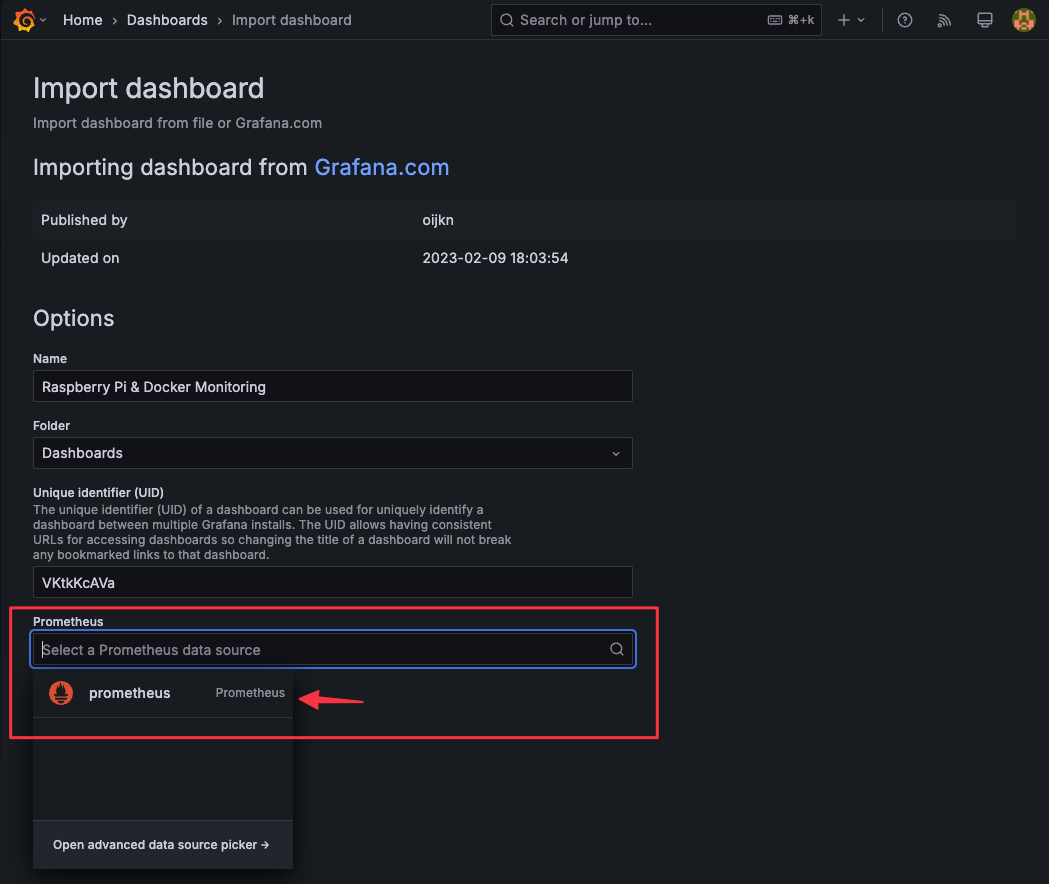
選擇對應的 prometheus Data Source
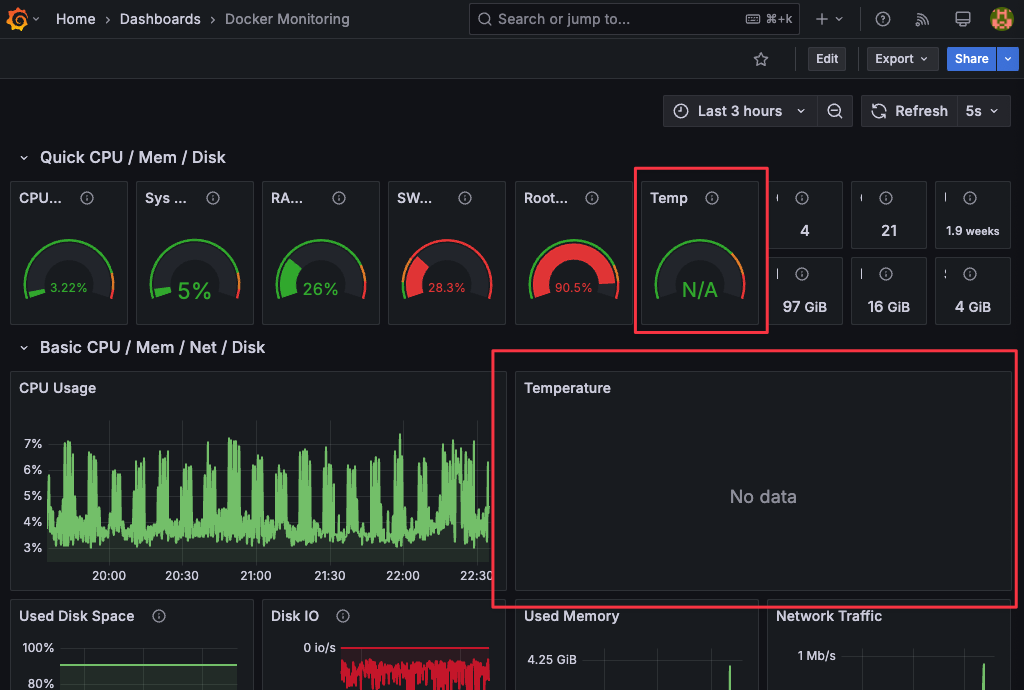
預設 node-exporter 會通過 /sys/class/thermal 底下的 thermal_zone* 來獲取 cpu 溫度。但某些電腦並沒有相關的 sensor,因此 /sys/class/thermal 中不會有相關的檔案,因此在 dashboard 中 cpu 溫度相關的 panel 會沒有數據。