
This guide walks you through setting up a monitoring system for Nginx Proxy Manager using Promtail, Loki, and Grafana. By parsing Nginx logs and visualizing the data, you can track traffic patterns, status codes, and other key metrics. We’ll cover deploying Grafana, Loki, and Promtail, configuring Nginx Proxy Manager with geoip2 and JSON logging, and setting up the data source and dashboard in Grafana.
Promtail parses Nginx Proxy Manager logs and sends them to the Loki database. Grafana reads data from Loki and visualizes it through dashboards.
1. Deploy Grafana#
If you don’t already have a Grafana container running, check out the Grafana deployment guide.
2. Create a Docker Network#
To facilitate communication between Grafana, Loki, and Promtail containers, we’ll create a bridge network. If you have an alternative setup, feel free to skip to Step 3.
- You can create the network through Portainer’s network configuration interface.
- Or use the command:
docker network create grafanaRemember to update your Grafana container configuration to include this network.
3. Configure Nginx Proxy Manager Settings#
Two modifications are required for Nginx: enabling geoip2 and configuring JSON log formatting.
Enable geoip2#
Create the following directory structure and files in your Nginx data folder:
/appdata/npm/data/nginx
├── custom
│   |── events.conf
│   |── http_top.conf
│   └── server_proxy.conf
└──  geoip2
    |── GeoLite2-ASN.mmdb
    |── GeoLite2-City.mmdb
    └── GeoLite2-Country.mmdb
Download the GeoLite2 database files (or refer to P3TERX/GeoLite.mmdb):
events.confworker_connections 20000; multi_accept on;http_top.confgeoip2 /data/nginx/geoip2/GeoLite2-Country.mmdb { auto_reload 5m; $geoip2_metadata_country_build metadata build_epoch; $geoip2_data_country_code default=TW source=$remote_addr country iso_code; $geoip2_data_country_name default=Taiwan country names en; } geoip2 /data/nginx/geoip2/GeoLite2-City.mmdb { $geoip2_data_city_name default=Unknown city city names en; } geoip2 /data/nginx/geoip2/GeoLite2-ASN.mmdb { $geoip2_data_asn_code default=000 autonomous_system_number; } log_format json_analytics escape=json '{' '"time_local": "$time_local", ' '"remote_addr": "$remote_addr", ' '"request_uri": "$request_uri", ' '"status": "$status", ' '"server_name": "$server_name", ' '"request_time": "$request_time", ' '"request_method": "$request_method", ' '"bytes_sent": "$bytes_sent", ' '"http_host": "$http_host", ' '"http_x_forwarded_for": "$http_x_forwarded_for", ' '"http_cookie": "$http_cookie", ' '"server_protocol": "$server_protocol", ' '"upstream_addr": "$upstream_addr", ' '"upstream_response_time": "$upstream_response_time", ' '"ssl_protocol": "$ssl_protocol", ' '"ssl_cipher": "$ssl_cipher", ' '"http_user_agent": "$http_user_agent", ' '"remote_user": "$remote_user", ' '"geoip2_data_country_code": "$geoip2_data_country_code", ' '"geoip2_data_country_name": "$geoip2_data_country_name", ' '"geoip2_data_city_name": "$geoip2_data_city_name", ' '"geoip2_data_asn_code": "$geoip2_data_asn_code"' '}';server_proxy.confaccess_log /data/logs/json_access.log json_analytics; error_log /data/logs/json_error.log warn;
Create additional configuration files:
/appdata/npm/nginx-configs
└── nginx-configs
    ├── modules
    |   └── geoip2.conf
    └── proxy.conf
File contents:
geoip2.confLoads the geoip2 module:
load_module /usr/lib/nginx/modules/ngx_http_geoip2_module.so; load_module /usr/lib/nginx/modules/ngx_stream_geoip2_module.so;proxy.confAdds necessary headers:
# geoip2
proxy_set_header geoip2-COUNTRY-CODE $geoip2_data_country_code;
proxy_set_header geoip2-COUNTRY-NAME $geoip2_data_country_name;
proxy_set_header geoip2-CITY-NAME    $geoip2_data_city_name;
proxy_set_header geoip2-ASN-CODE     $geoip2_data_asn_code;
proxy_set_header geoip2-IP-Address   $remote_addr;

# default
add_header       X-Served-By $host;
proxy_set_header Host $host;
proxy_set_header X-Forwarded-Scheme $scheme;
proxy_set_header X-Forwarded-Proto  $scheme;
proxy_set_header X-Forwarded-For    $proxy_add_x_forwarded_for;
proxy_set_header X-Real-IP          $remote_addr;
proxy_pass       $forward_scheme://$server:$port$request_uri;
Add the following volume mappings to your Nginx Proxy Manager Docker Compose file:
volumes:
  - /appdata/npm/nginx-configs/proxy.conf:/etc/nginx/conf.d/include/proxy.conf
  - /appdata/npm/nginx-configs/modules/geoip2.conf:/etc/nginx/modules/geoip2.conf
Restart Nginx Proxy Manager after making these changes.
4. Deploy Loki and Promtail#
4.1. Loki Configuration#
Create the directory structure and configuration file:
/appdata └── loki └── config-loki └── local-config.yamllocal-config.yamlauth_enabled: false server: http_listen_port: 3100 common: path_prefix: /loki storage: filesystem: chunks_directory: /loki/chunks rules_directory: /loki/rules replication_factor: 1 ring: kvstore: store: inmemory schema_config: configs: - from: 2020-10-24 store: boltdb-shipper object_store: filesystem schema: v11 index: prefix: index_ period: 24h ruler: alertmanager_url: http://localhost:9093 query_scheduler: max_outstanding_requests_per_tenant: 2048 limits_config: allow_structured_metadata: false
Update folder permissions:
Since Loki runs as user ID 10001, you’ll need to adjust ownership:
sudo chown -R 10001:10001 /appdata/loki
4.2. Promtail Configuration#
Create the directory structure and configuration file:
/appdata └── promtail └── config-promtail └── config.ymlconfig.ymlserver: http_listen_port: 9080 grpc_listen_port: 0 positions: filename: /tmp/positions.yaml clients: - url: http://loki:3100/loki/api/v1/push scrape_configs: - job_name: npm_logs static_configs: - targets: - localhost labels: job: npm_logs __path__: /var/log/npm-logs/json_*.log pipeline_stages: - json: expressions: time_local: time_local remote_addr: remote_addr request_uri: request_uri status: status server_name: server_name request_time: request_time request_method: request_method bytes_sent: bytes_sent http_host: http_host http_x_forwarded_for: http_x_forwarded_for http_cookie: http_cookie server_protocol: server_protocol upstream_addr: upstream_addr upstream_response_time: upstream_response_time ssl_protocol: ssl_protocol ssl_cipher: ssl_cipher http_user_agent: http_user_agent remote_user: remote_user geoip2_data_country_code: geoip2_data_country_code geoip2_data_country_name: geoip2_data_country_name geoip2_data_city_name: geoip2_data_city_name - labels: status: server_name: request_method: geoip2_data_country_code: geoip2_data_country_name:
4.3. Docker Compose Configuration#
services:
  loki:
    image: grafana/loki:latest
    restart: 'unless-stopped'
    ports:
      - "3100:3100"
    command: -config.file=/etc/loki/local-config.yaml
    volumes:
      - /home/rxchi1d/appdata/loki:/loki # Loki persistent data folder
      - /home/rxchi1d/appdata/loki/config-loki:/etc/loki # Loki config folder
    networks:
      - grafana

  promtail:
    image: grafana/promtail:latest
    restart: 'unless-stopped'
    volumes:
      - /home/rxchi1d/appdata/npm/data/logs/:/var/log/npm-logs:ro # path to your NPM logs, add else if you need
      - /home/rxchi1d/appdata/promtail/config-promtail/config.yml:/etc/promtail/config.yml # Promtail config folder
    command: -config.file=/etc/promtail/config.yml
    networks:
      - grafana

networks:
  grafana:
    external: true
5. Configure Grafana#
Access Grafana (http://grafana-host:3000)
Add a data source:
Navigate to
Connections→Data sourcesand selectAdd new data sourceChoose
LokiSet the Name to
lokiand the Connection URL tohttp://loki:3100. ClickSave & test.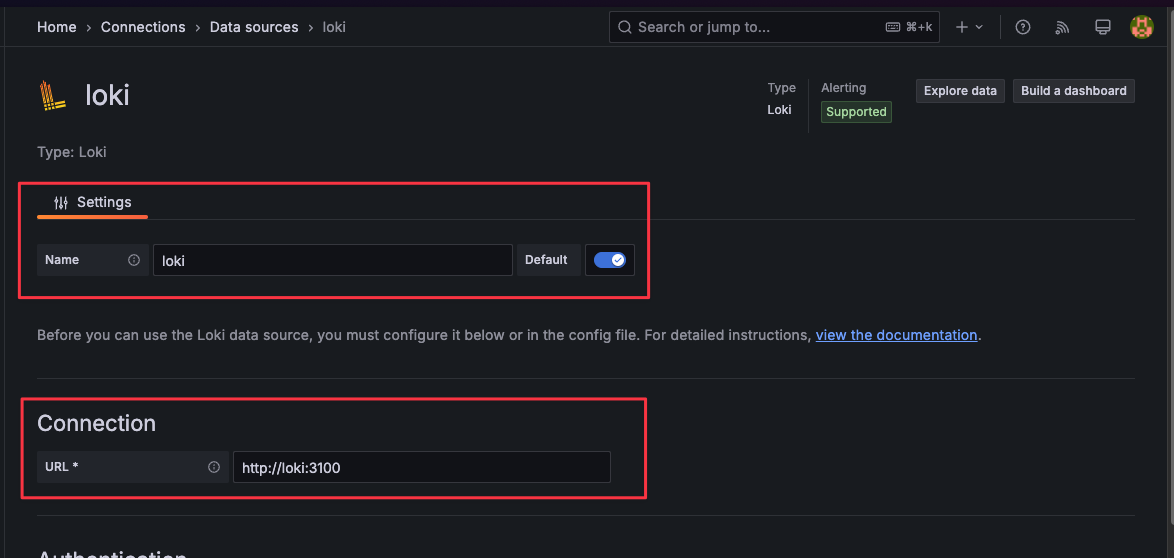
Import the dashboard:
Go to
Dashboards, clickNew→Import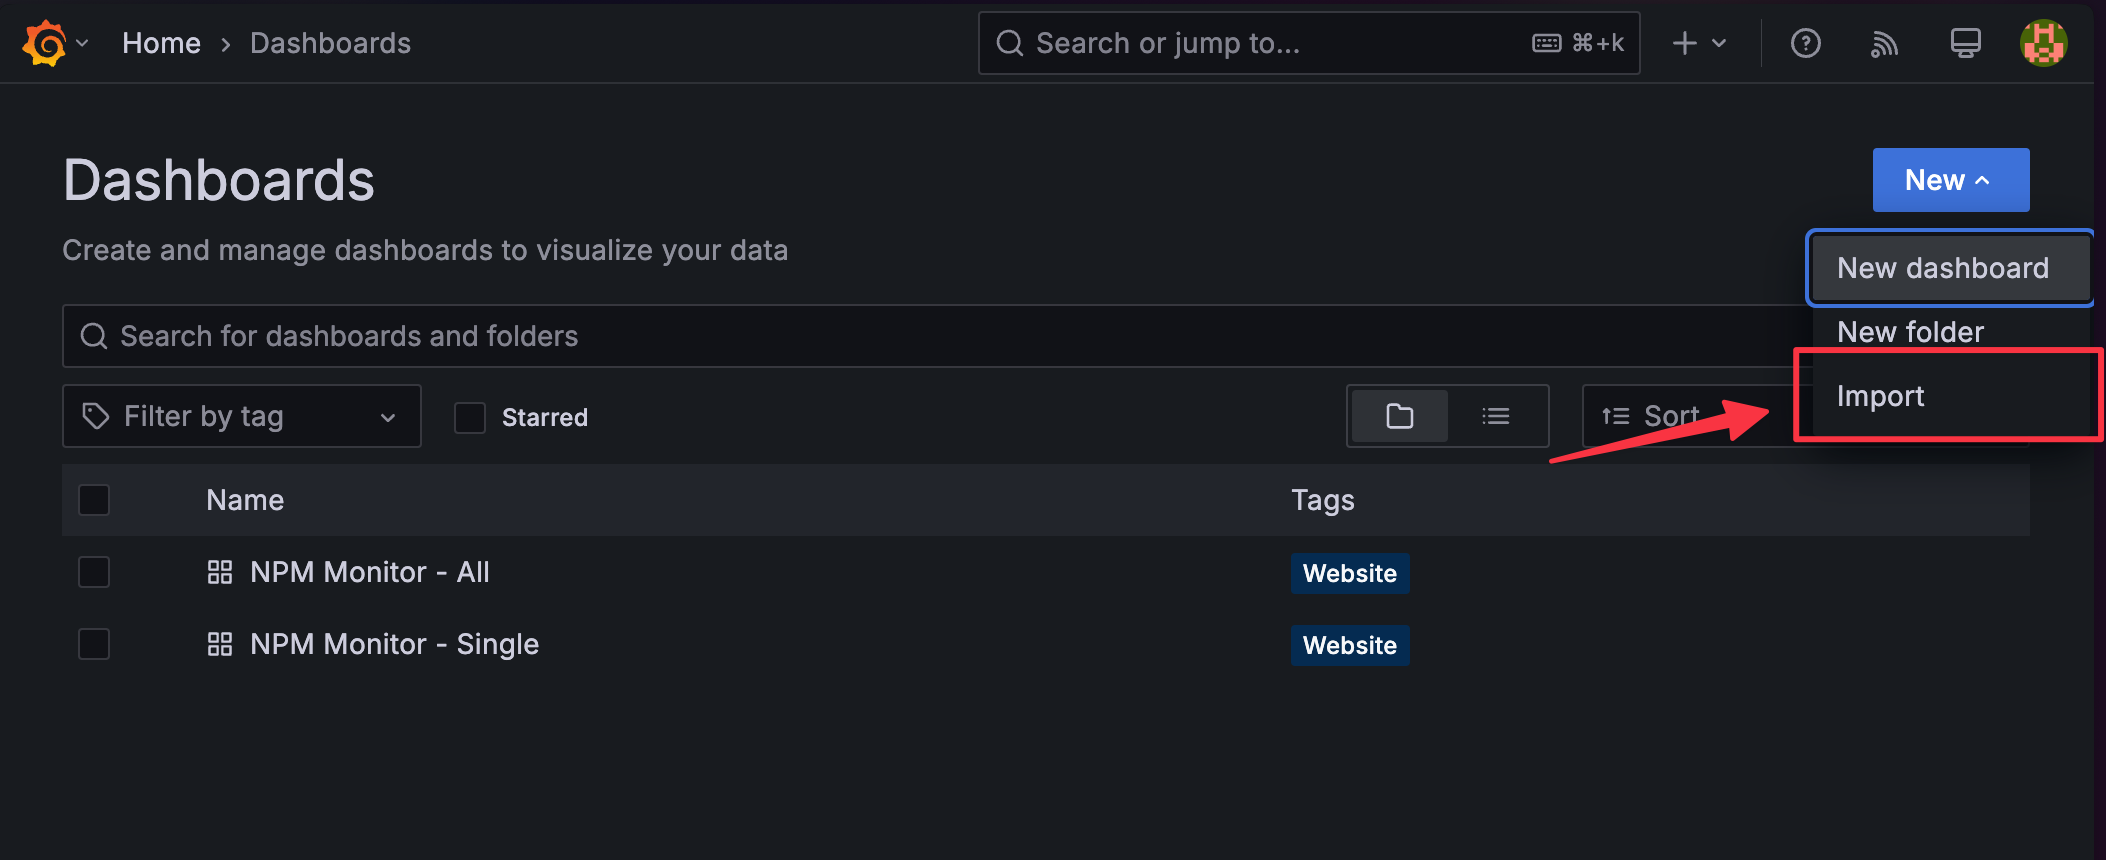
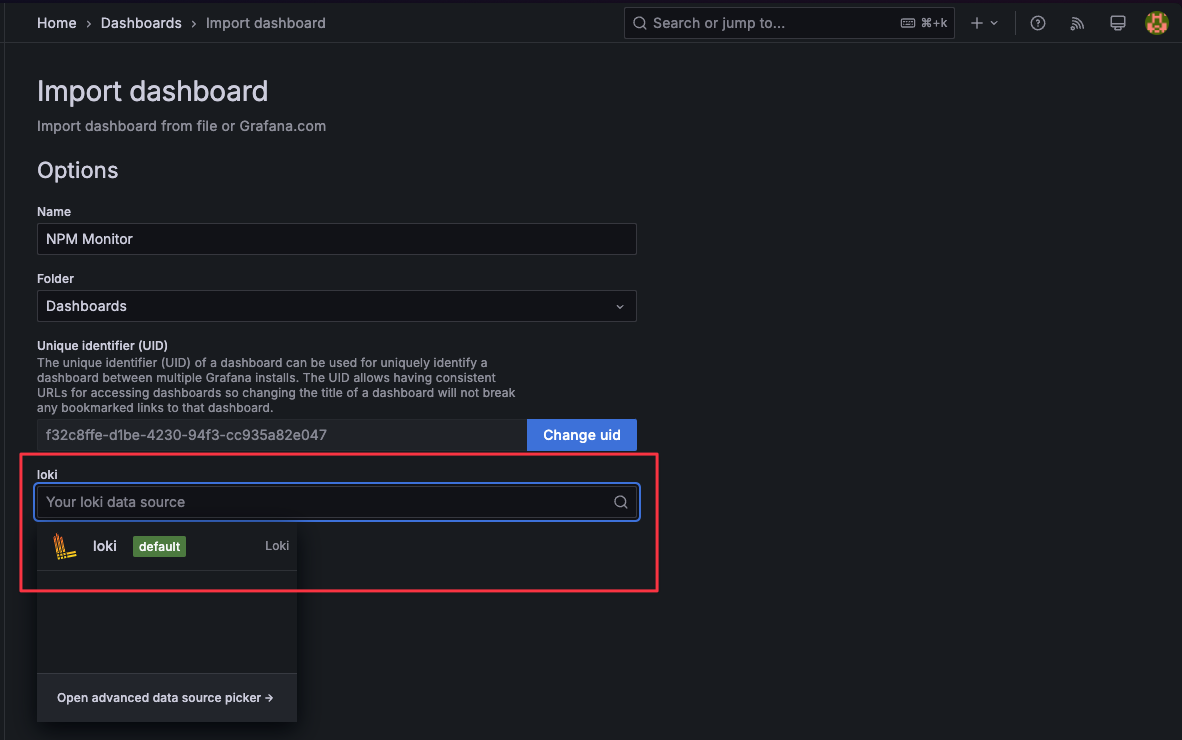
Upload the NPM Monitor JSON file:
Select the corresponding Loki data source:
Customize labelFilter and regexFilter as needed:
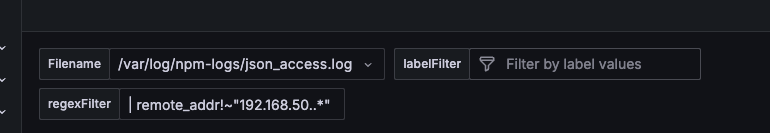
The default regexFilter excludes data originating from the
192.168.50.0/24subnet.Filter priority: labelFilter takes precedence over regexFilter.
Why Two Types of Filters?labelFilter offers better performance and is easier to use, but converting high-cardinality data to labels can burden Loki. For fields with many unique values like remote_addr, use regexFilter instead.