This comprehensive guide demonstrates how to build a complete Docker container monitoring system using Prometheus, Node Exporter, cAdvisor, and Grafana. We’ll cover creating Docker networks, preparing Prometheus configuration, deploying monitoring services with Docker Compose, and configuring Grafana data sources and dashboards to effectively monitor Docker container performance and status.
Promtail parses Nginx Proxy Manager logs and sends them to the Loki database. Grafana reads data from Loki and visualizes it through dashboards.
1. Deploy Grafana#
If you don’t already have a Grafana container running, check out the Grafana deployment guide.
2. Create a Docker Network#
To facilitate communication between Grafana, Loki, and Promtail containers, we’ll create a bridge network. If you have an alternative setup, feel free to skip to Step 3.
- You can create the network through Portainer’s network configuration interface.
- Or use the command:
docker network create grafana3. Prepare Prometheus Directory and Configuration#
Create the following directory structure and files:
/appdata/prometheus ├── config │ └── prometheus.yml └── dataprometheus.yml# my global config global: scrape_interval: 15s # Set the scrape interval to every 15 seconds. Default is every 1 minute. evaluation_interval: 15s # Evaluate rules every 15 seconds. The default is every 1 minute. # scrape_timeout is set to the global default (10s). # Alertmanager configuration alerting: alertmanagers: - scheme: http static_configs: - targets: - "alertmanager:9093" # Load rules once and periodically evaluate them according to the global 'evaluation_interval'. #rule_files: # - "first_rules.yml" # - "second_rules.yml" # A scrape configuration containing exactly one endpoint to scrape: # Here it's Prometheus itself. scrape_configs: # The job name is added as a label `job=<job_name>` to any timeseries scraped from this config. - job_name: 'prometheus' # Override the global default and scrape targets from this job every 5 seconds. scrape_interval: 5s static_configs: - targets: ['localhost:9090'] - job_name: 'cadvisor' scrape_interval: 5s static_configs: - targets: ['cadvisor:8080'] - job_name: 'node-exporter' scrape_interval: 5s static_configs: - targets: ['node-exporter:9100']
Update folder permissions
Prometheus runs as user ID 65534 by default:
sudo chown -R 65534:65534 /appdata/prometheus
4. Deploy Prometheus, Node Exporter, and cAdvisor#
docker compose fileservices: cadvisor: container_name: cadvisor image: gcr.io/cadvisor/cadvisor:latest hostname: cadvisor restart: unless-stopped privileged: true networks: - grafana expose: - 8080 command: - '-housekeeping_interval=15s' - '-docker_only=true' - '-store_container_labels=false' devices: - /dev/kmsg volumes: - /:/rootfs:ro - /var/run:/var/run:rw - /sys:/sys:ro - /var/lib/docker/:/var/lib/docker:ro - /dev/disk/:/dev/disk:ro - /etc/machine-id:/etc/machine-id:ro node-exporter: container_name: node-exporter image: prom/node-exporter:latest hostname: node-exporter restart: unless-stopped networks: - grafana expose: - 9100 command: - --path.procfs=/host/proc - --path.sysfs=/host/sys - --path.rootfs=/host - --collector.filesystem.mount-points-exclude - ^/(sys|proc|dev|host|etc|rootfs/var/lib/docker/containers|rootfs/var/lib/docker/overlay2|rootfs/run/docker/netns|rootfs/var/lib/docker/aufs)($$|/) volumes: - /proc:/host/proc:ro - /sys:/host/sys:ro - /:/rootfs:ro - /:/host:ro,rslave prometheus: container_name: prometheus image: prom/prometheus:latest hostname: prometheus restart: unless-stopped command: - '--config.file=/etc/prometheus/prometheus.yml' - '--storage.tsdb.path=/prometheus' - '--storage.tsdb.retention.time=1y' # /!\ Uncomment the following line to set a size limit for the Prometheus database /!\ # - '--storage.tsdb.retention.size=10GB' networks: - grafana expose: - 9090 volumes: # /!\ To be modified depending on your needs /!\ - /home/rxchi1d/appdata/prometheus/data:/prometheus - /home/rxchi1d/appdata/prometheus/config/prometheus.yml:/etc/prometheus/prometheus.yml depends_on: - cadvisor - node-exporter networks: grafana: external: true
5. Configure Grafana#
Access Grafana (
http://grafana-host:3000)Add a data source:
Navigate to
Connections→Data sourcesand selectAdd new data sourceChoose
PrometheusSet the Name to
prometheusand the Connection URL tohttp://prometheus:9090. ClickSave & test.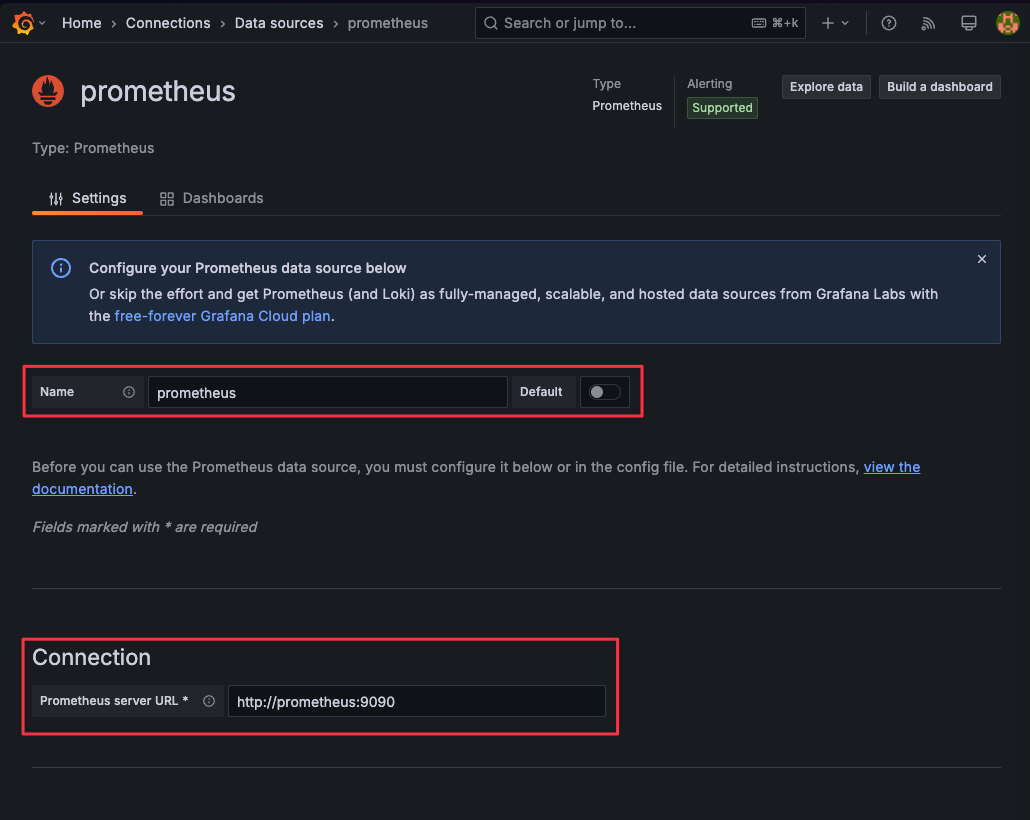
Import the dashboard:
Go to
Dashboards, clickNew→Import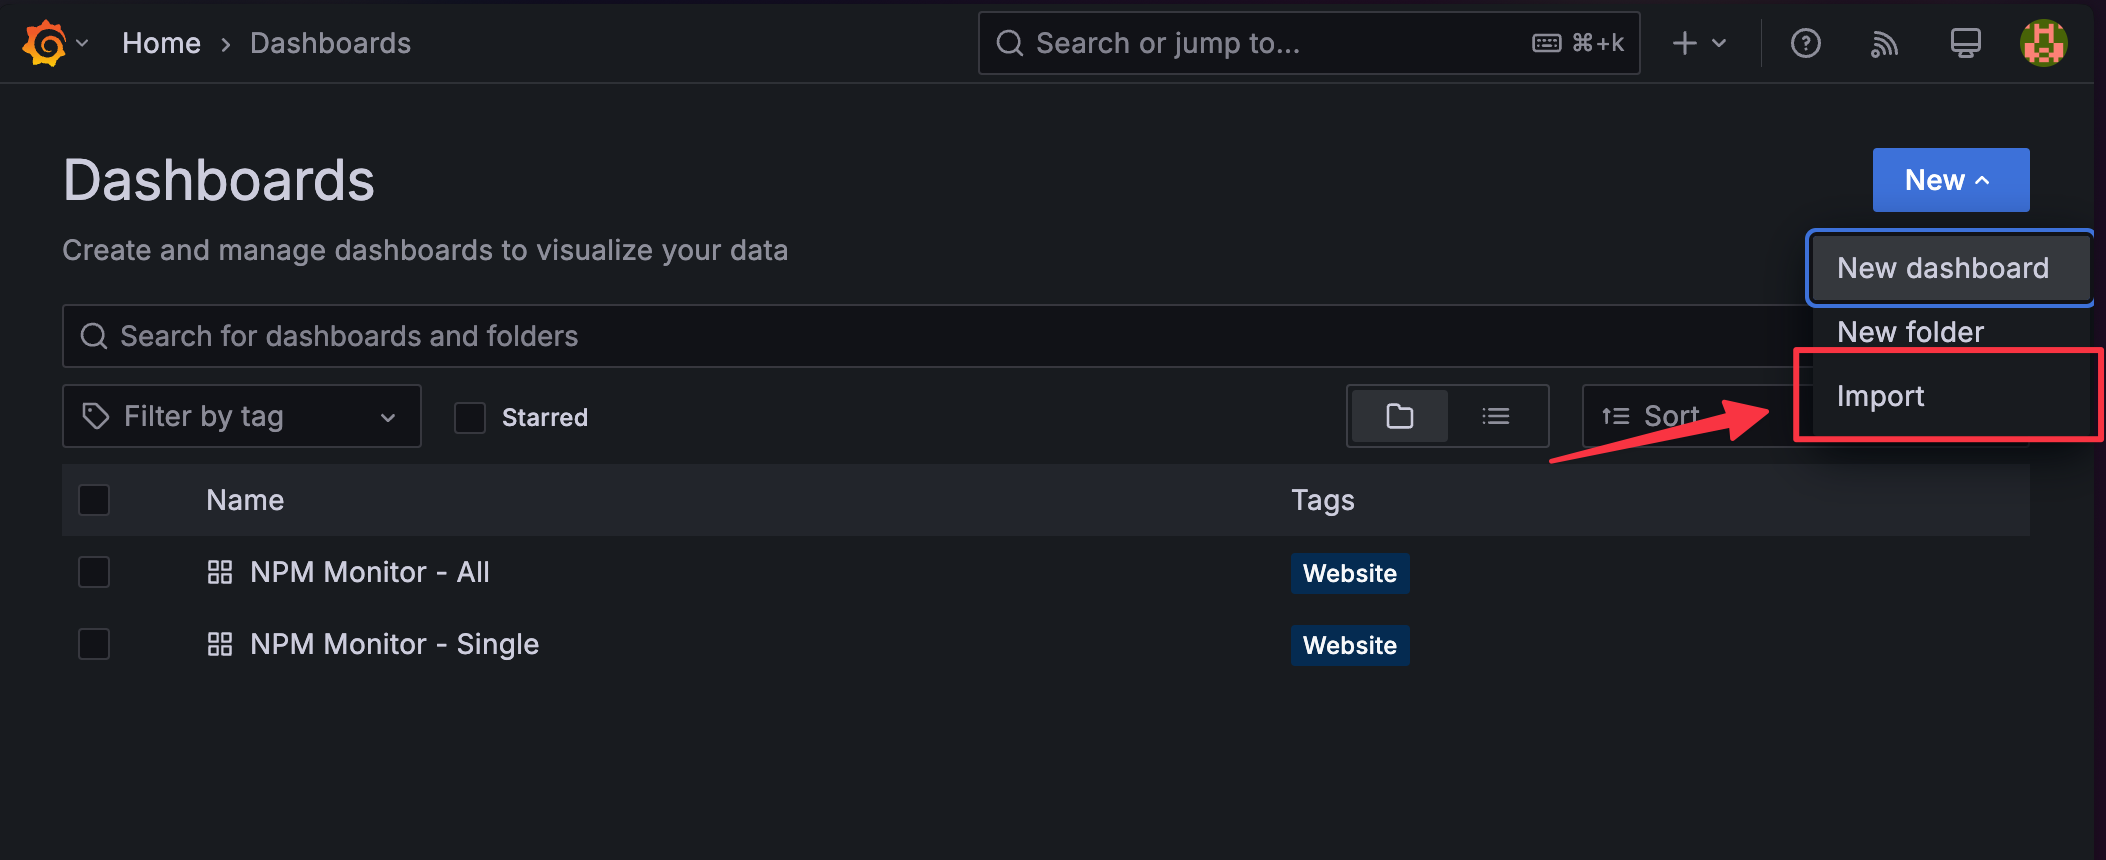
Upload the NPM-Monitor JSON
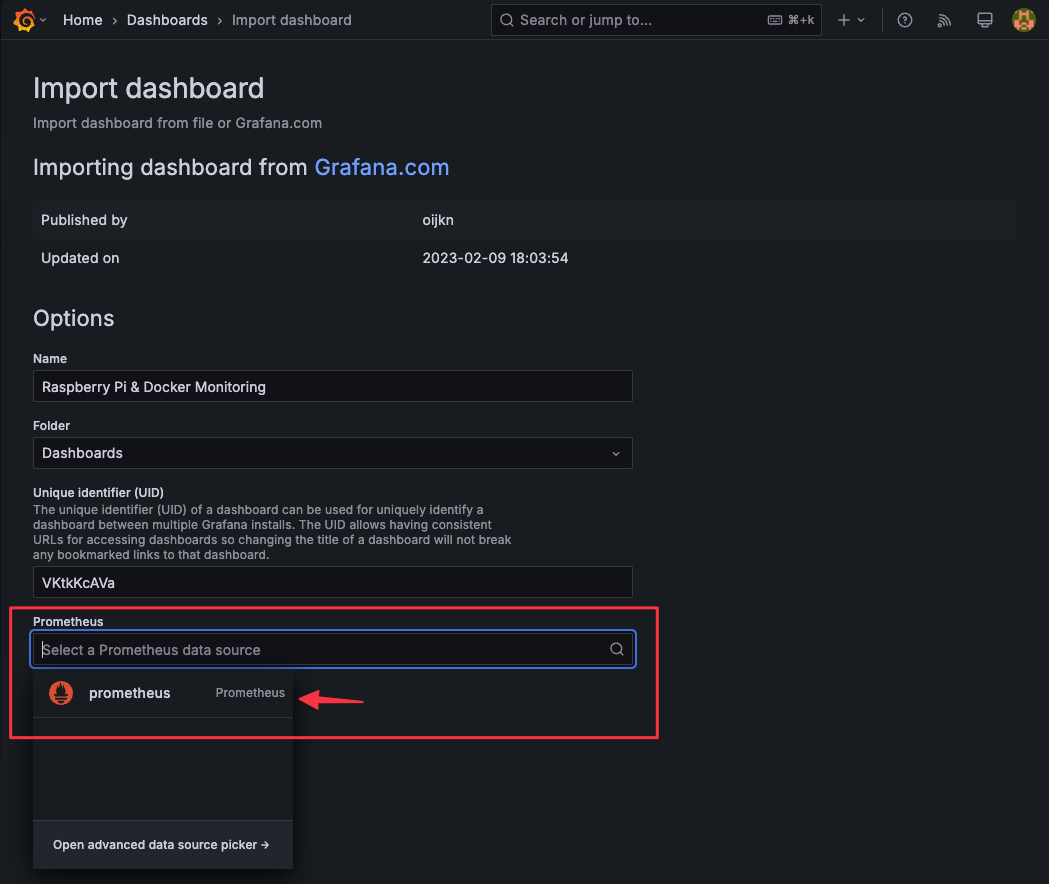
Use dashboard ID
15120to create the dashboard.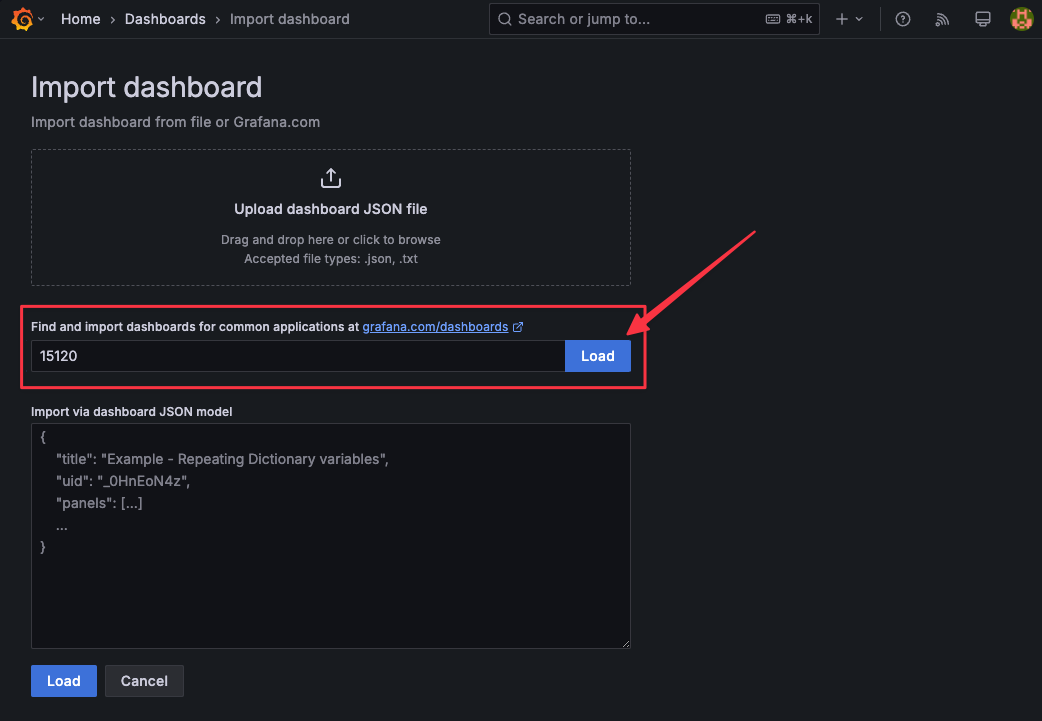
Select the corresponding Prometheus data source:
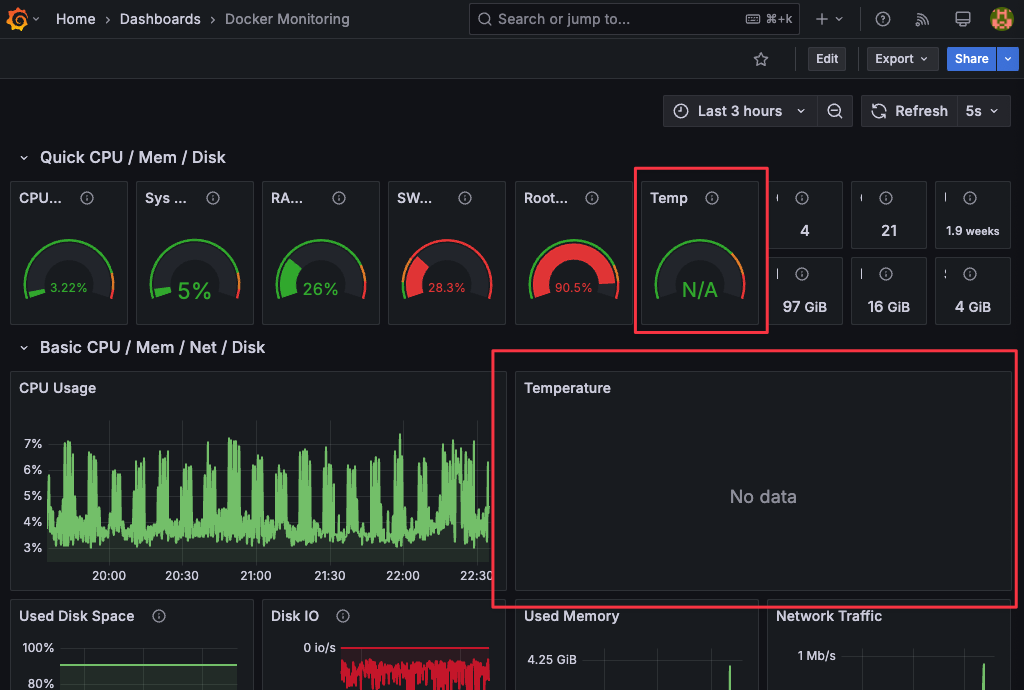
By default, node-exporter retrieves CPU temperature from thermal_zone* files in /sys/class/thermal. However, some systems lack the necessary sensors, resulting in no temperature data files in /sys/class/thermal. Consequently, CPU temperature panels in the dashboard will display no data.